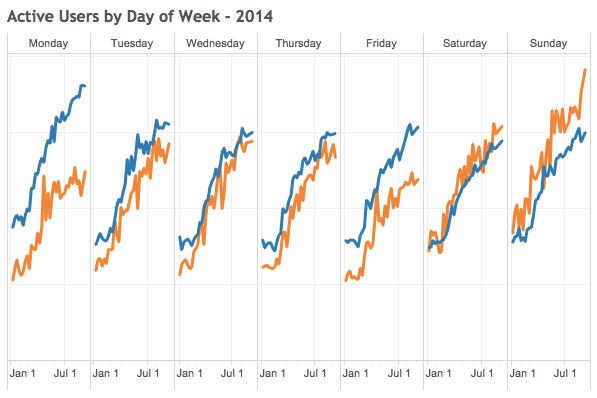
Just as our athletes are obsessed with tracking and analyzing their athletic pursuits, we here at Strava are obsessed with tracking our own performance; but instead of wattage and pace, we’re concerned with activity and engagement. In this post, I’ll talk a little bit about the infrastructure that powers our internal analytics and reporting.
View More.
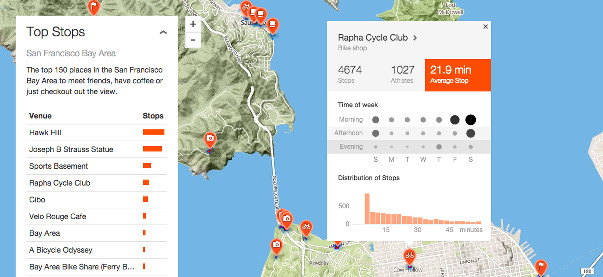
Strava has done a lot of work figuring out how athletes move; we have global heatmaps, challenge heatmaps, personal heatmaps and even Strava Metro. But what about where people go to stop? I looked at 4.3 million rides in the San Francisco Bay Area to answer this question and found the best places to meet friends, have coffee or just check out the view.
View More.
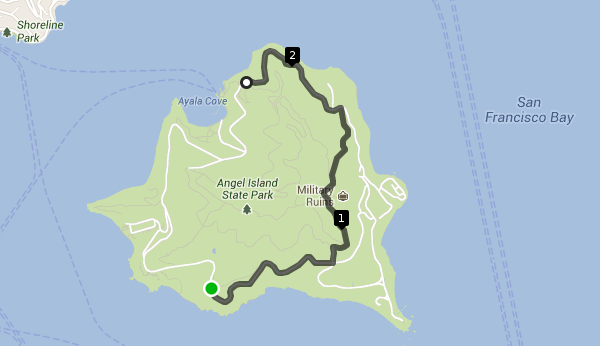
RouteMaster is the engine that powers point to point path finding for Strava routes in our newly released Route Builder. The killer feature of RouteMaster is data drawn from real Strava athletes. Instead of merely knowing which paths are designated for cycling/running, we analyze tens of billions of GPS points from millions of Strava activities. This data gives aggregate statistics about how athletes use every road and path section in the world.
View More.
Recently we introduced a heatmapping feature on Strava, our first feature built using the Go programming language. This is part of work to move Strava towards a service-oriented architecture with well-defined interfaces that can be written in any language.
View More.
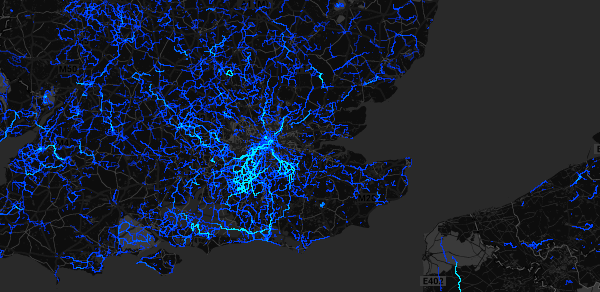
On Saturday July 20th athletes covered 4,890,000 miles in over 326,000 combined hours. To get a look at what all that riding looks like I built the Saturday on Strava Heatmap, a visual of all those miles, broken down by hour.
View More.